Sales analytics in complex B2B: unlock real revenue impact
Learn how complex B2B sales leaders can move beyond dashboards and operationalize sales analytics to drive real revenue outcomes and workflow efficiency.
TL;DR:
- Most B2B organizations focus on activity metrics rather than outcome-based analytics that drive revenue.
- Embedding targeted, tiered analytics into sales workflows enhances decision-making and sales performance.
- Data quality issues are the main barrier to effective analytics, requiring clear standards and regular audits.
Despite 89% of B2B organizations adopting analytics and AI tools, only 40% operationalize them effectively. That gap is not a technology problem. It is an execution problem. Most sales leaders assume that adding dashboards or investing in AI platforms automatically translates to better decisions and higher revenue. It rarely does. This guide cuts through that confusion by defining what sales analytics truly means in complex B2B environments, how to structure it for real outcomes, and how to embed it where it matters most: inside your team’s daily workflows.
Table of Contents
- What is sales analytics (and why B2B leaders get it wrong)
- Key analytics tiers: From revenue outcomes to leading indicators
- Data quality: The silent killer of analytics (and how to fix it)
- How to operationalize analytics for sales team efficiency
- Why the best-performing sales orgs look beyond the latest tech
- Make analytics your revenue driver with Uman
- Frequently asked questions
Key Takeaways
PointDetailsAnalytics require clear purposeUnderstanding analytics tiers ensures measurement aligns with revenue outcomes and strategy.Data quality is criticalTrustworthy analytics depend on ongoing data hygiene and cross-team accountability.Workflow integration drives adoptionEmbedding analytics in daily sales routines, not isolated dashboards, boosts efficiency.Technology is not a shortcutTrue impact comes from process discipline and execution, not just deploying new tools.
What is sales analytics (and why B2B leaders get it wrong)
Sales analytics is the practice of collecting, interpreting, and acting on data across the sales process to improve performance and revenue outcomes. Simple enough in theory. In practice, most B2B organizations treat it as a reporting function rather than a decision-making engine, and that distinction costs them.
There are four core methodologies, and understanding each one is essential before you can use them correctly. Sales analytics involves descriptive, diagnostic, predictive, and prescriptive methodologies to generate actionable insights. Here is what each one actually means:
- Descriptive analytics: Tells you what happened. Win rates last quarter, average deal size, pipeline volume. Useful for context, but not for action.
- Diagnostic analytics: Tells you why it happened. Why did win rates drop? Which segments underperformed and what caused it?
- Predictive analytics: Tells you what is likely to happen. Which deals are at risk? Which accounts are ready to expand?
- Prescriptive analytics: Tells you what to do. Recommends next best actions, optimal outreach timing, or cross-sell angles based on account data.
Most B2B sales organizations invest heavily in descriptive analytics and stop there. They build elaborate dashboards showing email volumes, call counts, and pipeline stages. These are activity metrics, and they are not the same as strategic, outcome-focused insights.
Vanity metrics like email open rates or number of calls logged rarely drive revenue. They measure effort, not effectiveness. The question is not how much your team is doing, but whether what they are doing is moving the right deals forward.
The confusion runs deeper in complex B2B environments. When you manage a broad service portfolio and long sales cycles, the temptation is to track everything. But tracking more data without a clear framework for sales cycle optimization only adds noise. Volume of data is not a substitute for clarity of insight.
Another common error is conflating AI adoption with analytics maturity. Deploying an AI tool does not mean your team is generating actionable intelligence. Understanding AI limitations in sales is just as important as understanding its potential. AI amplifies the quality of your inputs. If those inputs are poorly defined metrics or unstructured data, the outputs will be equally unreliable.
The fix starts with being honest about which analytics tier you are actually operating in, and whether your current metrics connect to revenue outcomes at all.
Key analytics tiers: From revenue outcomes to leading indicators
With the boundaries of sales analytics defined, how do effective B2B organizations prioritize and structure these insights for maximum impact? A tiered framework helps clarify this.
Sales leaders in complex B2B should prioritize tiered analytics embedded in workflows to drive efficiency and revenue. The three tiers work as follows:
TierWhat it measuresBusiness valueTier 1: Revenue outcomesClosed revenue, quota attainment, deal valueDirect measure of sales successTier 2: Lagging indicatorsWin/loss rates, average sales cycle length, churnExplains what drove revenue resultsTier 3: Leading indicatorsEngagement scores, buyer group coverage, pipeline velocityPredicts future revenue performance
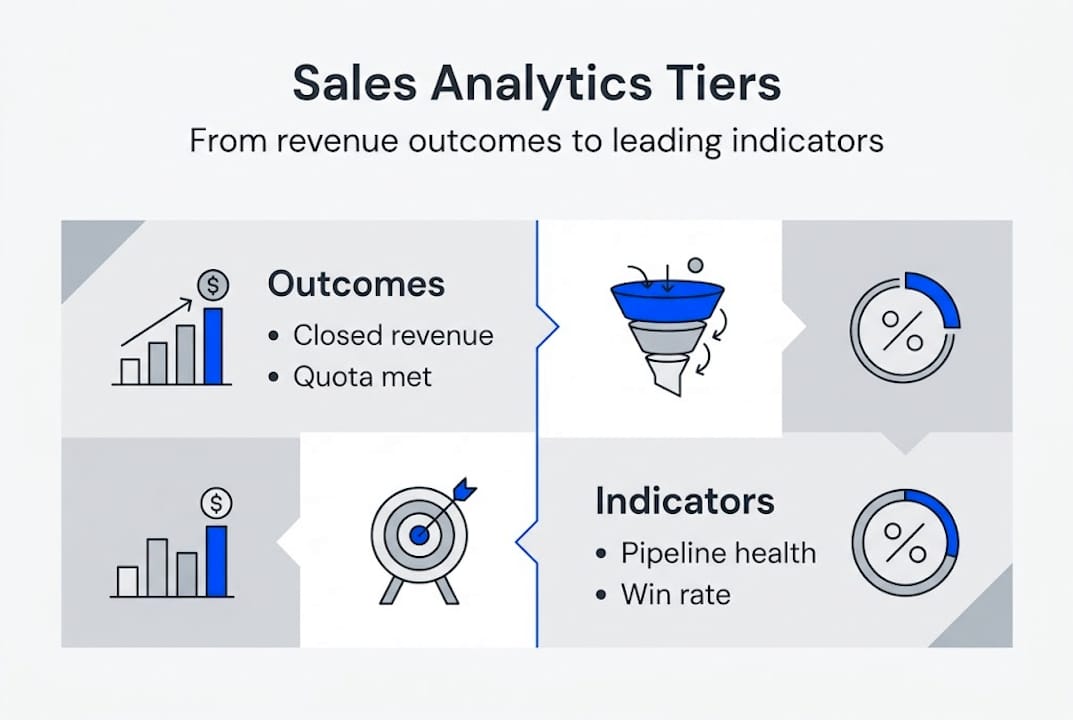
Most teams focus almost entirely on Tier 1 and Tier 2. They review win rates after the quarter closes and wonder why performance is inconsistent. The real leverage is in Tier 3. Leading indicators give you the ability to intervene before a deal is lost, not after.
Here is how to move from activity metrics to revenue-driving analytics in practice:
- Audit your current metrics. List every metric your team tracks and categorize it by tier. Most organizations discover they are 80% focused on lagging or vanity metrics.
- Define your revenue hypothesis. Identify which leading indicators in your specific sales environment correlate most strongly with closed revenue. Buyer group engagement is often underrated.
- Retire metrics that do not connect to outcomes. Remove dashboard clutter. Every metric should have a clear line to a business decision.
- Assign ownership. Each key metric needs an owner who is accountable for monitoring and acting on it.
- Embed metrics into workflow touchpoints. Insights should surface during meeting prep, deal reviews, and account planning, not only in weekly reports.
Pro Tip: The most effective analytics setups are not the most complex ones. Build effective analytics integration by embedding tiered metrics directly into the moments where your reps make decisions, not into siloed dashboards they check once a week.
For revenue-centric strategies to take hold, the analytics layer must feel like a natural part of how your team works, not an additional reporting burden.
Data quality: The silent killer of analytics (and how to fix it)
After understanding what to measure, the most common pitfall is not analytics strategy but the quality of the underlying data. Poor data hygiene is not a minor inconvenience. It is a structural failure that undermines every analytics initiative you run.

84% of sales leaders underperform on analytics influence due to data quality issues, and high performers are 46% more likely to prioritize data hygiene as a core discipline. That is not a marginal difference. It is the gap between analytics that generate revenue and analytics that generate reports nobody trusts.
The garbage-in, garbage-out principle is especially damaging when AI is involved. AI models trained or fed on incomplete, inconsistent, or outdated CRM data will produce recommendations that are confidently wrong. This is one of the core impacts of bad data in AI-assisted sales environments: the system sounds authoritative while pointing your team in the wrong direction.
Here are the data hygiene practices that high-performing B2B sales organizations follow:
- Define data standards upfront. Every critical field in your CRM needs a clear definition, acceptable values, and an owner. Ambiguity in data entry leads to inconsistency at scale.
- Conduct regular audits. Quarterly data audits catch drift before it compounds. Check for duplicates, missing fields, outdated account information, and inconsistent categorization.
- Align sales, marketing, and IT. Data quality is a cross-functional problem. Sales reps enter data. Marketing uses it for targeting. IT manages the systems. All three need shared standards.
- Monitor AI model drift. If you use predictive or prescriptive AI tools, track whether model accuracy degrades over time as your market or portfolio evolves.
- Build feedback loops. Make it easy for reps to flag data errors. If correcting bad data is painful, it will not happen consistently.
Pro Tip: Appoint data stewards for each critical field in your CRM. A named owner for account status, opportunity stage, and contact role dramatically reduces inconsistency. This is especially important when AI for sales prospecting depends on accurate account and contact data to generate relevant outreach.
How to operationalize analytics for sales team efficiency
The right priorities and data hygiene mean nothing unless your team uses analytics in their daily routines. This is where most analytics programs stall. The insights exist, but they live in a dashboard that no one opens between monthly reviews.
Only 40% of organizations operationalize AI analytics effectively, often due to poor workflow embedding and cross-functional misalignment. The solution is not better dashboards. It is embedding analytics directly into the moments where your reps make decisions.
The difference between a dashboard and embedded analytics is significant. A dashboard is a destination your team visits. Embedded analytics is a layer that surfaces insights inside the tools and workflows your team already uses, during meeting preparation, deal qualification, or account review.
Here is a step-by-step approach to making it work:
- Design for the workflow, not the report. Map your sales process and identify every decision point. Build analytics to surface at those exact moments.
- Upskill your team. Analytics literacy is not optional. Reps need to understand what the data means and how to act on it. Short, practical training sessions work better than lengthy onboarding programs.
- Pilot before you scale. Run a focused pilot with one team or segment. Measure adoption, decision quality, and revenue impact before rolling out broadly.
- Align sales, ops, and IT from day one. Analytics operationalization fails when it is treated as a sales project. It requires system access, data governance, and process design from all three functions.
ActionOwnerExpected outcomeMap decision points in sales processSales leadershipClear integration targets for analyticsDefine embedded insight triggersSales ops + ITInsights surface at the right momentRun pilot with one teamSales managerValidated adoption and impact dataExpand with feedback loopCross-functional teamScalable, trusted analytics adoption
Refer to workflow best practices and CRM impact in analytics for deeper guidance on connecting your data infrastructure to sales execution.
Why the best-performing sales orgs look beyond the latest tech
Here is an uncomfortable truth: the organizations seeing the strongest analytics-driven revenue gains are not always the ones with the most advanced tools. They are the ones with the most disciplined execution.
Technology is an amplifier. It makes good processes faster and bad processes more visibly broken. When sales leaders chase the newest AI feature or analytics platform without fixing underlying workflow and data problems first, they accelerate their existing dysfunction. That is not a technology failure. It is a leadership failure.
The best-performing teams we observe share three traits. They have clear KPI ownership, meaning every metric has a named decision-maker. They have consistent handoffs between sales, marketing, and operations. And they treat sales process discipline as a competitive advantage, not an administrative burden.
Our advice: obsess over execution clarity before you invest in the next analytics upgrade. A well-embedded, well-governed analytics layer built on clean data will outperform a sophisticated AI platform running on inconsistent inputs every time.
Make analytics your revenue driver with Uman
These lessons are actionable, especially when you use the right platform to turn them into practice.
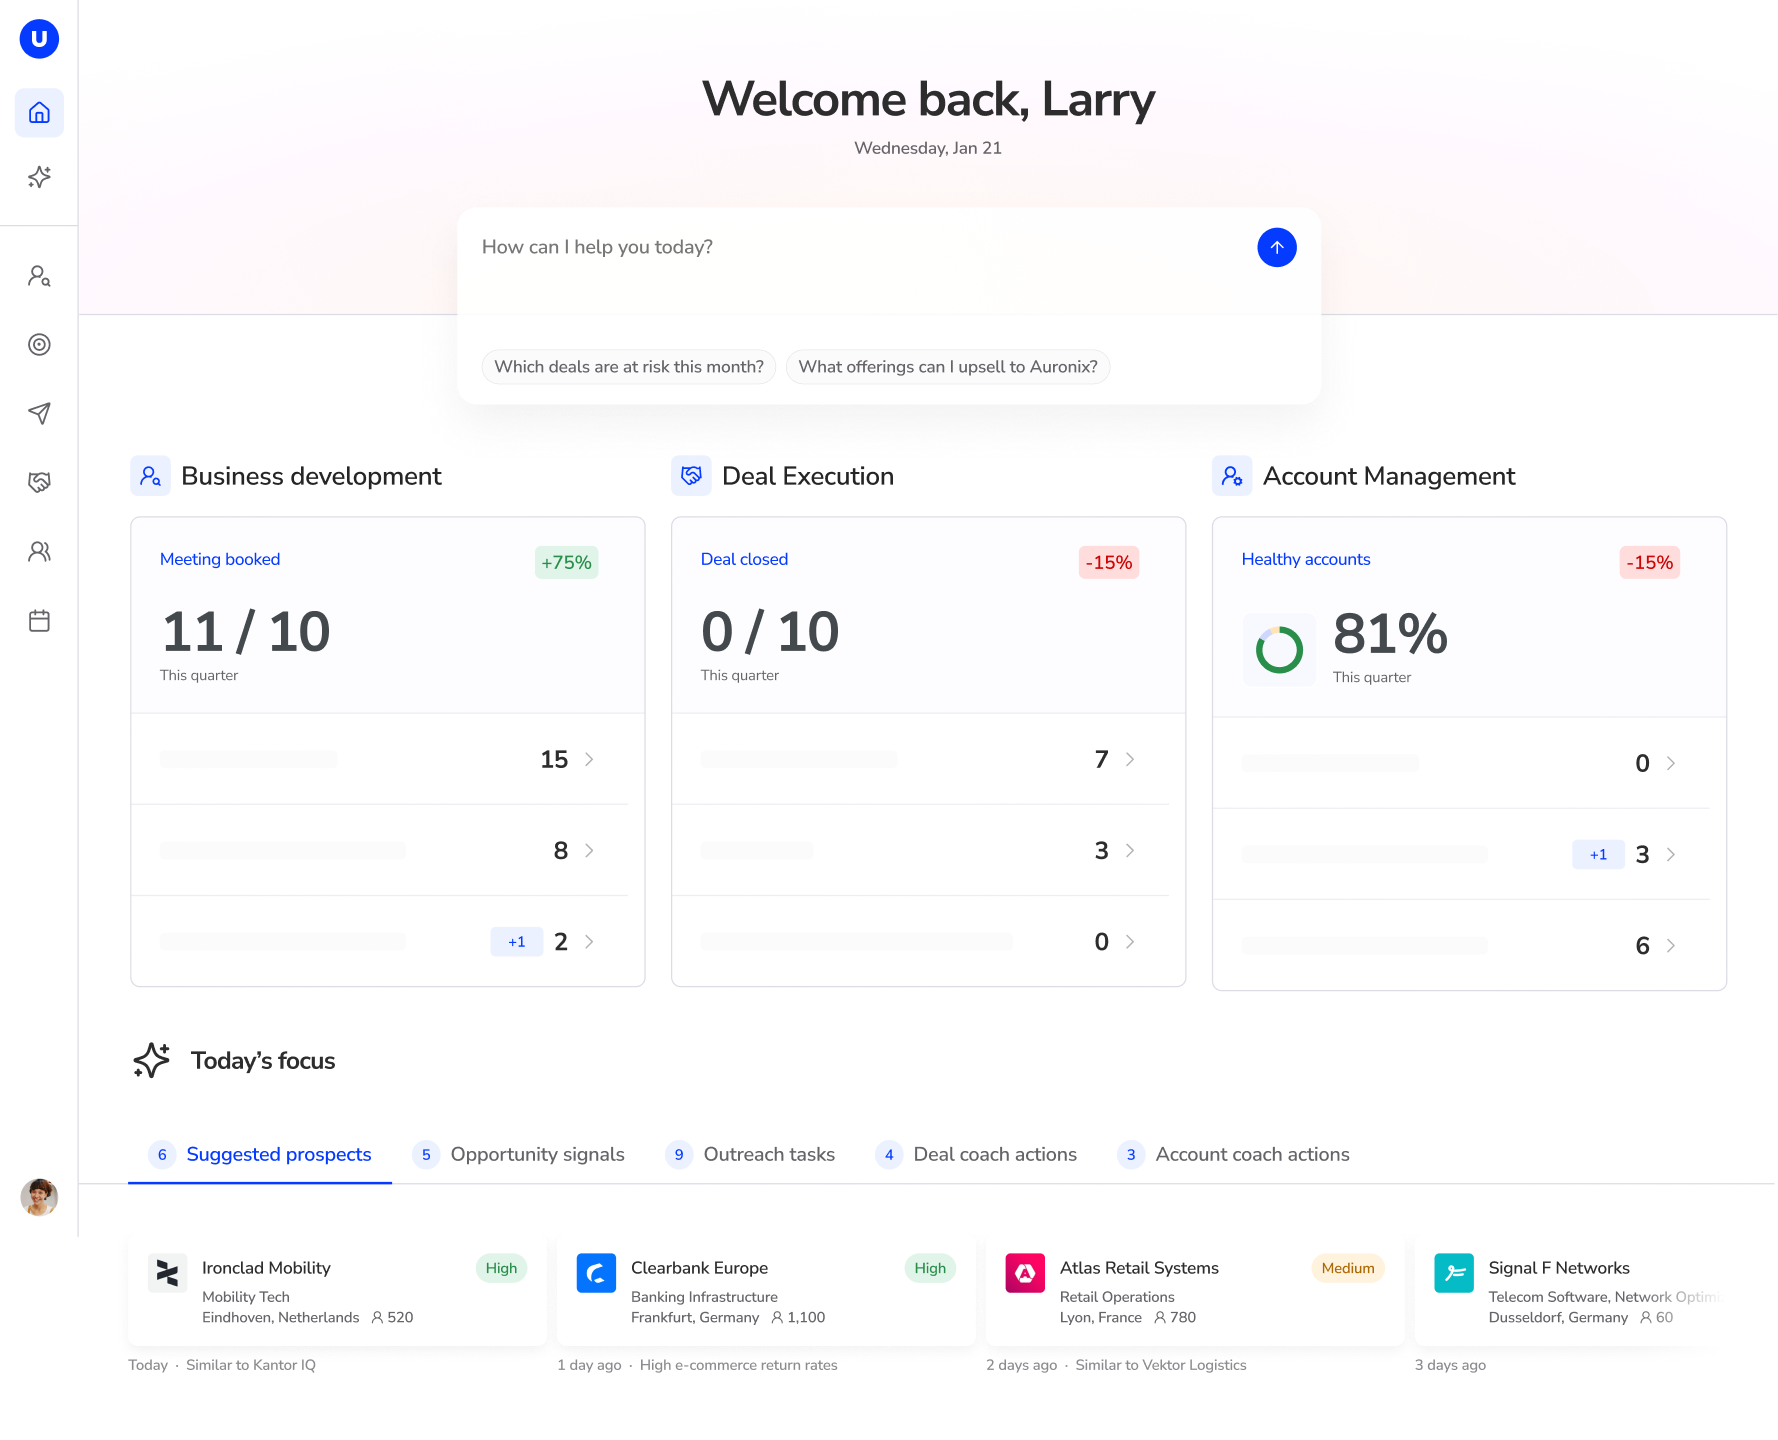
Uman is built specifically for complex B2B sales organizations that need more than dashboards. The Uman analytics platform centralizes your sales knowledge and embeds insights directly into structured workflows across business development, deal execution, and account management. It supports data stewardship, reduces administrative burden, and helps your team act on the right information at the right moment. The deal execution tools are designed to surface relevant insights during meeting prep and qualification, not after the fact. If you are ready to move from analytics adoption to analytics impact, explore what Uman can do for your sales organization.
Frequently asked questions
What are the four main types of sales analytics?
The four types are descriptive, diagnostic, predictive, and prescriptive analytics, each delivering unique insights that support different stages of B2B sales decision-making.
Why do analytics projects fail in complex B2B sales?
Most failures stem from poor data quality and lack of workflow integration. 84% of sales leaders underperform on analytics due to data quality issues, which makes AI-generated insights unreliable and difficult to act on.
How can B2B sales leaders improve data quality for analytics?
Set clear data ownership, conduct regular audits, and align sales, marketing, and IT around shared standards. High-performing companies are 46% more likely to treat data hygiene as a core organizational discipline.
What is the difference between dashboards and embedded analytics?
Dashboards display information passively and require your team to seek out insights. Embedded analytics, as highlighted in Gartner’s sales productivity research, deliver relevant insights directly within the workflows where sales decisions are actually made.
Recommended

Prep like a machine, sell like a human
Let AI handle the research and prep work — you focus on building relationships and closing deals.